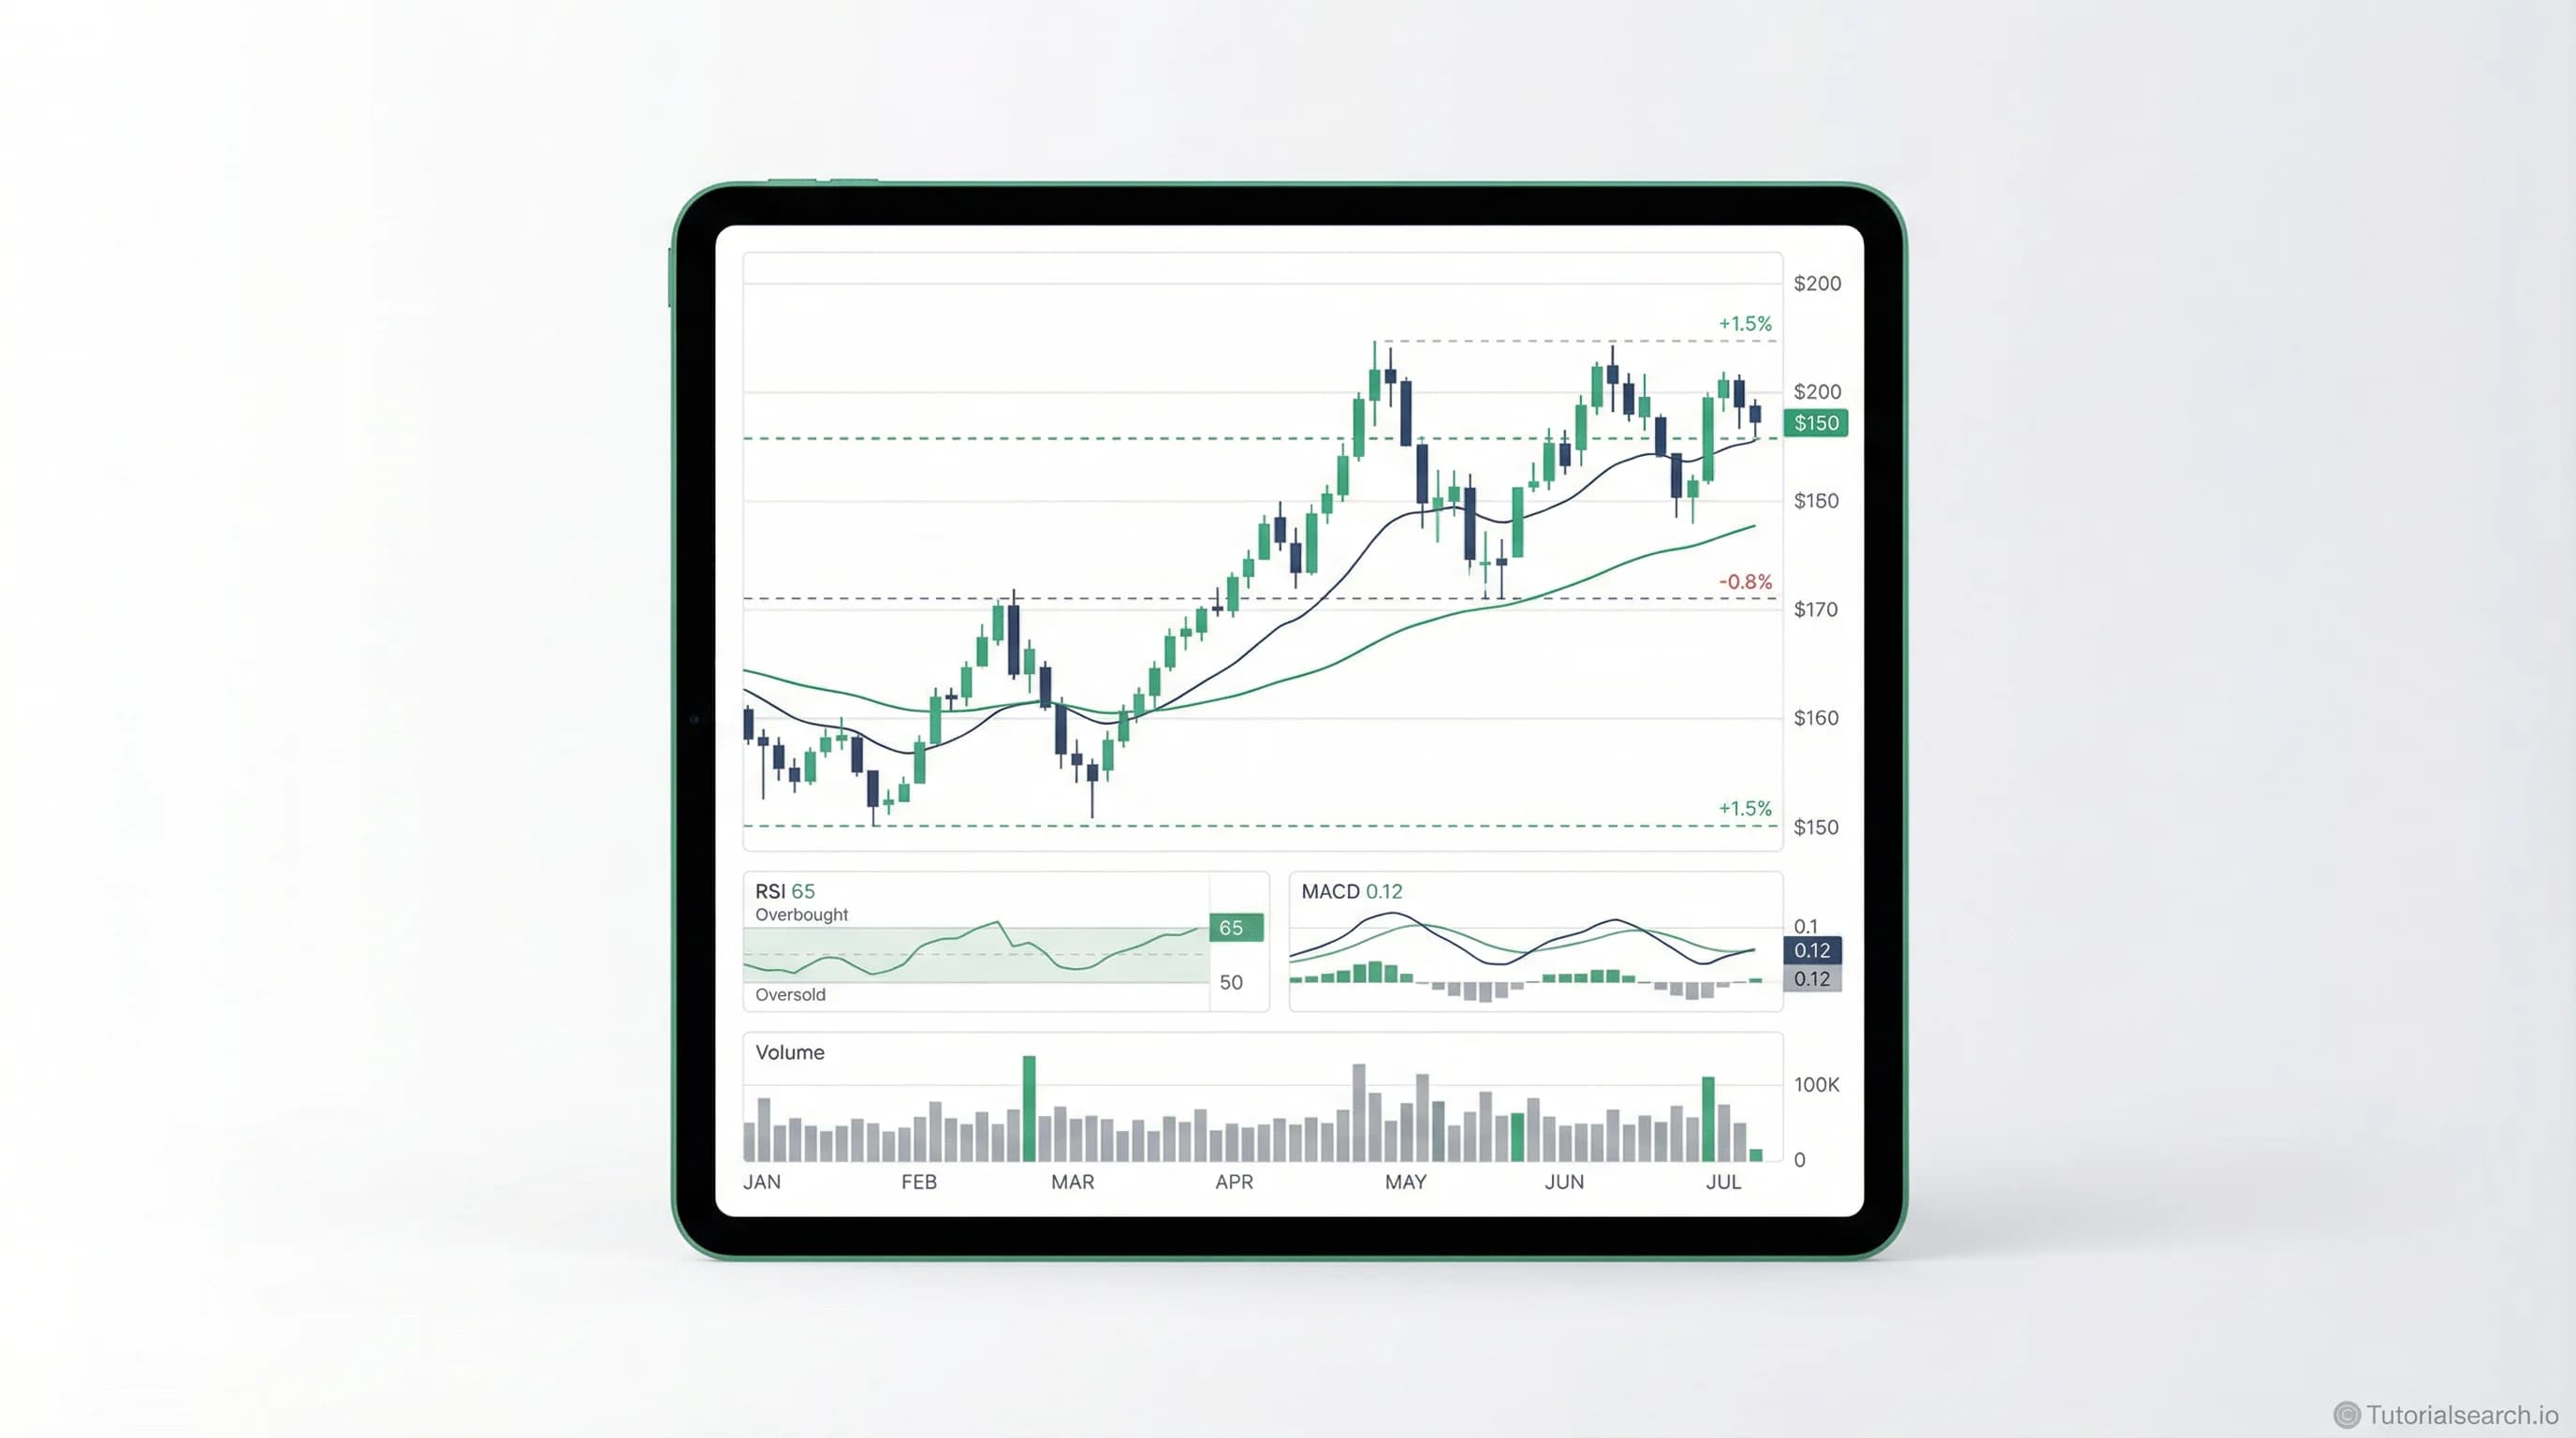
Want to Learn Technical Analysis? Here's Where to Start
Technical analysis helps traders read price charts to time entries and exits — this guide covers the best courses, free resources, YouTube channels, GitHub repos, and books to get you started.
Hire the developers behind TutorialSearch.io
We built this site — full-stack web apps, AI integration & automation. Tell us what you need and we'll build yours.
Technical analysis is how traders read price charts to decide when to buy and when to sell. It's used across stocks, forex, crypto, and futures — any market where price history exists.
Here's the number that stopped me when I first researched this: over 75% of active retail traders say technical analysis is their primary method for timing trades. That's not because charts predict the future. It's because price and volume data are universally available, completely transparent, and free. Anyone with a brokerage account can see the same chart a hedge fund trader sees.
Contrast that with fundamental analysis, which requires weeks of research per stock. Technical analysis gives you a repeatable, visual system you can apply to any market. That's the appeal. That's also why technical analysis courses are consistently among the most enrolled on every learning platform — there are 236+ courses browseable on TutorialSearch.io in this area alone.
One honest note before we go further: technical analysis doesn't predict the future with certainty. No indicator does. What it does is help you identify high-probability setups and manage your risk. That's the right mindset going in.
Key Takeaways
- Technical analysis uses price charts and volume data to spot trading opportunities and time entries and exits.
- Free technical analysis courses from IG Academy, Chart Guys, and Alison cover the essentials without any cost.
- The highest-rated paid technical analysis courses on Udemy have 100,000+ enrollments and strong beginner-friendly track records.
- Most learners build a working foundation in 4–8 weeks of consistent study.
- Combining a structured course with a reference book like John Murphy's classic gives you both speed and depth.
In This Article
- The Technical Analysis Courses That Actually Deliver
- Free Technical Analysis Resources Worth Bookmarking
- Technical Analysis on YouTube — The Channels Worth Your Time
- Technical Analysis GitHub Repos Worth Starring
- For When You Want to Go Deep With Technical Analysis
- The Honest Paid vs. Free Breakdown
- Related Skills That Pair Well With Technical Analysis
- Frequently Asked Questions About Technical Analysis
The Technical Analysis Courses That Actually Deliver
Most beginners try to learn technical analysis through random YouTube videos and indicator explainers. That works — eventually. A structured course compresses months of scattered learning into hours of clear, ordered content.
These are the courses worth your attention right now.
[Editors' Choice] 1. Technical Analysis Fundamentals For Beginners by Wealthy Education (Udemy) — Free
This is the course I'd tell a friend to start with. Over 111,000 students have enrolled, and it costs nothing. Wealthy Education has a no-hype teaching style: clear explanations, real charts, no promises of easy profits.
You'll cover how to read charts, identify support and resistance levels, draw trend lines, and interpret core indicators. It's been updated for 2025, which matters — older TA courses sometimes reference platforms and tools that no longer look the way they used to.
2. Technical Analysis 101: Master the Basics of Trading by Luca Moschini (Udemy) — Paid
Moschini takes a different approach from most TA instructors. He focuses on why patterns work, not just what they look like. That conceptual grounding sticks with you long after the course ends.
With a 4.69 rating from nearly 21,000 students, this is the highest-quality paid beginner option I've found. When you're ready for more, Moschini's Technical Analysis 102 goes deeper on price action and advanced setups.
[Editors' Choice] 3. Technical Analysis MasterClass: Trading By Technical Analysis by Jyoti Bansal (Udemy) — Paid
Jyoti Bansal holds NCFM and NISM certifications — professional-grade trading analyst qualifications. This MasterClass has 137,000+ students, making it one of the most enrolled TA courses anywhere.
It covers indicators (MACD, RSI, Bollinger Bands), candlestick patterns, chart patterns, and real trade examples. Bansal's companion course, the Technical Analysis Stock Trading Practice Assignment Course, forces you to apply everything with real assignments — which is where most self-study falls apart.
4. Technical Analysis: Candlestick Trading For Beginners by Wealthy Education (Udemy) — Free
Candlestick patterns are the visual language of technical analysis. Once you can read them fluently, chart analysis gets faster and more intuitive. This free course focuses entirely on candlesticks, which makes it a better starting point for visual learners than a broad survey course.
It pairs well with Wealthy Education's chart patterns course below.
5. Technical Analysis: Chart Pattern Trading For Beginners by Wealthy Education (Udemy) — Free
Chart patterns — head and shoulders, double tops, triangles, flags — take longer to form than candlestick signals, but tend to be more reliable. This free course covers the major ones with real chart examples.
[Editors' Choice] 6. Technical Analysis with Python for Algorithmic Trading by Alexander Hagmann (Udemy) — Paid
This one isn't for complete beginners. It's for people who already understand the basics and want to automate their analysis. Hagmann uses Python to code technical indicators from scratch and backtest trading strategies programmatically.
If you work in data or software, this course bridges two fields in a way that opens doors to trading analysis careers that pure chart traders can't access.
Browse the full technical analysis course library to find options beyond these picks.
Free Technical Analysis Resources Worth Bookmarking
Everyone lists paid Udemy courses. Fewer people mention that some of the best TA education is completely free.
IG Academy: Introduction to Technical Analysis (Free)
IG is a major broker, and their educational content is designed to work — they train real clients with it. This free course covers TA basics in a clean, practical format. You don't need to be an IG customer to access it.
Chart Guys Free Intro to Technical Analysis (Free)
Chart Guys is one of the more respected independent TA education sites. Their free intro course covers chart types, pattern identification, and core indicators. These are traders teaching analysis — not marketers teaching a course. That difference comes through in the content.
Alison: Stock Market Technical Analysis (Free)
Alison's free course covers trend spotting, chart reading, and basic trading strategies. It's lighter than the others, but works well as a first exposure before you commit to something more intensive.
Charles Schwab: Getting Started with Technical Analysis (Free)
Written by a brokerage that trains its own staff with this material. Schwab's guide is well-organized and genuinely useful — it covers moving averages, support and resistance, RSI, and how to combine indicators without getting overwhelmed. No sales pitch.
Corporate Finance Institute: Technical Analysis Guide (Free)
CFI has one of the better written references for TA concepts. Their coverage of the Dow Theory — the historical foundation of all modern technical analysis — is especially clear. If you prefer reading over watching videos, bookmark this one.
OANDA: Beginner's Guide to Technical Analysis (Free)
OANDA's TA guide is particularly useful for forex applications. If you're applying technical analysis to currency markets rather than stocks, this is worth your time.
Investopedia Technical Analysis Section (Free)
Investopedia's TA coverage is encyclopedic. Searching "Investopedia + [indicator name]" is one of the fastest ways to understand any specific tool. It's not a course, but it's the reference I still use when I encounter an unfamiliar indicator.
A note on pacing: most beginners over-complicate things. They jump to advanced indicators — Fibonacci extensions, Elliott Wave counts, complex oscillators — before understanding the basics. Spend at least two weeks on trend lines, support and resistance, and candlesticks before touching anything else. The free courses above are more than enough for that foundation.
If investment strategies also interest you, it's worth building both skills in parallel — they complement each other more than most people expect. Fundamentals tell you what to trade. Technicals tell you when.
Technical Analysis on YouTube — The Channels Worth Your Time
Hire the developers behind TutorialSearch.io
We built this site — full-stack web apps, AI integration & automation. Tell us what you need and we'll build yours.
YouTube is full of TA "gurus" promising 90% win rates. The channels below actually teach.
The Trading Channel (YouTube)
Stephen Hart has been producing TA education since 2014. His channel covers technical analysis, trading strategies, and market structure — and he explains why setups work, not just what they look like. Good for both beginners and intermediate traders.
Warrior Trading (YouTube)
Ross Cameron started Warrior Trading in 2013. The channel runs daily morning shows where Cameron trades live — you watch him apply TA in real time, which is worth more than most theoretical explanations. Dedicated beginner playlists cover TA fundamentals from scratch.
Bulls on Wall Street (YouTube)
Known for comprehensive, practical educational content on day trading, swing trading, and technical analysis. Their market psychology content is particularly good — understanding why patterns form is just as important as recognizing them.
One suggestion: watch a few videos from each channel before committing. Teaching style matters a lot in TA education. The right channel is the one whose approach makes charts click for you personally. Not every teacher explains things the same way, and that difference can be significant when you're learning to see patterns.
Technical Analysis GitHub Repos Worth Starring
These are worth your time if you're comfortable reading code or want a structured self-study curriculum.
awesome-stock-trading (GitHub)
A curated list of trading tools, websites, and learning materials. The TA section includes links to libraries, educational resources, and strategy references that are hard to find through regular searches.
Trading Curriculum by mikinty (GitHub)
A self-study curriculum for learning trading from first principles. It mixes readings with practical exercises, with an emphasis on building your own framework rather than copying someone else's system. Technical analysis is woven throughout.
Ta4j: Technical Analysis for Java (GitHub)
For developers who want to build TA systems programmatically, Ta4j is a well-documented Java library for technical analysis. It covers everything from basic indicator implementation to backtesting frameworks. The documentation is better than most open-source finance projects.
If you're also curious about trading analysis at a professional level, these repositories give you a sense of how quantitative traders approach systematic technical analysis beyond manual chart reading.
For When You Want to Go Deep With Technical Analysis
Books give you something courses don't: time with ideas. You can flip back, sit with a concept, and build a mental model over days rather than hours.
[Editors' Choice] Technical Analysis of the Financial Markets by John Murphy
This is the reference book. Murphy covers everything — chart types, trend analysis, volume, all major indicators, intermarket analysis, and more. It's not light reading. But if you work through it alongside a practical course, you'll understand technical analysis at a level most retail traders never reach.
Available in most libraries or around $35–40 new. Worth buying.
Getting Started in Technical Analysis by Jack Schwager
Schwager is best known for the Market Wizards interviews, but this book is his practical TA primer. More accessible than Murphy for most beginners — shorter chapters, cleaner structure, better for dipping in and out. Good first book before you tackle Murphy.
Encyclopedia of Chart Patterns by Thomas Bulkowski
Bulkowski did something most TA books skip: he statistically tested hundreds of chart patterns to see which ones actually perform. The results are sometimes surprising — some beloved patterns perform worse than random in his tests.
Read this after you have the basics. It'll make you a more skeptical, more disciplined chartist.
Technical Analysis for Dummies by Barbara Rockefeller
Don't let the title put you off. Rockefeller's book is clear, practical, and honest about the limits of TA. It's a genuinely good beginner book — especially if the bigger reference books feel overwhelming at first.
If financial analysis is also on your list, combining it with technical analysis gives you a complete toolkit. Fundamentals for what to trade, technicals for when.
The Honest Paid vs. Free Breakdown
Here's a quick guide to deciding where to start:
| Goal | Best Free Option | Best Paid Option |
|---|---|---|
| TA foundations | IG Academy Basics | Luca Moschini's TA 101 |
| Candlestick patterns | Wealthy Education (free on Udemy) | Jyoti Bansal MasterClass |
| Chart patterns | Chart Guys intro | Wealthy Education Chart Patterns |
| Algorithmic TA | Ta4j docs (GitHub) | Hagmann's Python TA course |
| Deep reference | CFI TA Guide + Investopedia | John Murphy's book |
The honest answer: the free options are sufficient to build a solid foundation. Paid courses add structure, instructor Q&A, and often more depth on specific setups. If you're starting from zero, begin with the free Wealthy Education Fundamentals course and the IG Academy basics before spending anything.
Related Skills That Pair Well With Technical Analysis
Once you understand the charts, these skills make your trading more complete.
- Trading Strategies — Technical analysis spots the opportunity. Trading strategies define how you act on it. Over 1,000 courses in this category.
- Investment Strategies — For longer time horizons, combining TA with investment frameworks changes how you think about position sizing and holding periods.
- Trading Analysis — A natural companion to TA, focused on market structure and reading order flow.
- Financial Planning — Risk management is half of trading. Financial planning builds the personal finance foundation that keeps trading sustainable long-term.
- Business Finance — Useful for traders who want to understand the businesses behind the charts they're reading.
- Personal Finance — Before trading capital, make sure your financial foundations are solid. These 680+ courses cover budgeting, savings, and smart money management.
- Accounting Fundamentals — Reading a balance sheet alongside a price chart gives you a significant edge when trading individual stocks.
- Financial Analysis — Understanding earnings and income statements complements TA when you're trading equities rather than indices or commodities.
Frequently Asked Questions About Technical Analysis
How long does it take to learn technical analysis?
Most people reach a working understanding of core TA in 4–8 weeks. The basics — trends, support and resistance, common indicators — take a few hours to learn conceptually. Applying them profitably in live trading takes 6–12 months of consistent practice.
Start with the Technical Analysis Fundamentals course and give yourself 30 days of reading charts every day before judging your progress. Pattern recognition builds faster than most beginners expect.
What is technical analysis used for in finance?
Technical analysis (TA) is used to identify trading opportunities and time market entries and exits. Traders use TA to spot price trends, recognize chart patterns, and interpret indicators like RSI (Relative Strength Index — a momentum measure), MACD (Moving Average Convergence Divergence — a trend-following indicator), and Bollinger Bands (a volatility measure). It applies across stocks, forex, crypto, futures, and commodities.
How does technical analysis differ from fundamental analysis?
Technical analysis focuses on price charts and volume. Fundamental analysis looks at a company's financial health — earnings, debt, management quality, industry position. TA asks "where is the price going?" Fundamental analysis asks "is this asset undervalued?" Many traders use both: fundamentals to pick what to trade, technicals to decide when.
Do I need a finance degree to learn technical analysis?
No. Most professional traders learned TA through self-study, courses, and books rather than formal education. A basic understanding of how markets work — what stocks and order types are — is all you need to start. The resources in this guide are all designed for self-directed learners.
Can I get a job with technical analysis skills?
Yes. Technical analysis skills are valued in roles like equity research analyst, portfolio manager, proprietary trader, and financial advisor. Systematic trading systems built on TA are used throughout banks and hedge funds. If the trading analysis career path interests you, combining TA knowledge with Python programming is particularly valuable right now.
What are the limitations of technical analysis?
Technical analysis produces false signals. Patterns that look reliable don't always play out. TA also can't account for sudden news events, earnings surprises, or geopolitical shocks that override chart structure entirely. Most experienced traders use TA as one input among several, not as a standalone oracle. Starting with that expectation makes you a more disciplined chartist from day one.
The best move right now: pick one free resource and one course and start together. The IG Academy basics and Wealthy Education's Fundamentals course are a solid pair. Give it 30 days of consistent study, read charts every day, and the patterns will start clicking. After that, Murphy's book takes you the rest of the way.
Browse all 236+ technical analysis courses on TutorialSearch.io to find the right fit for your level and learning style.