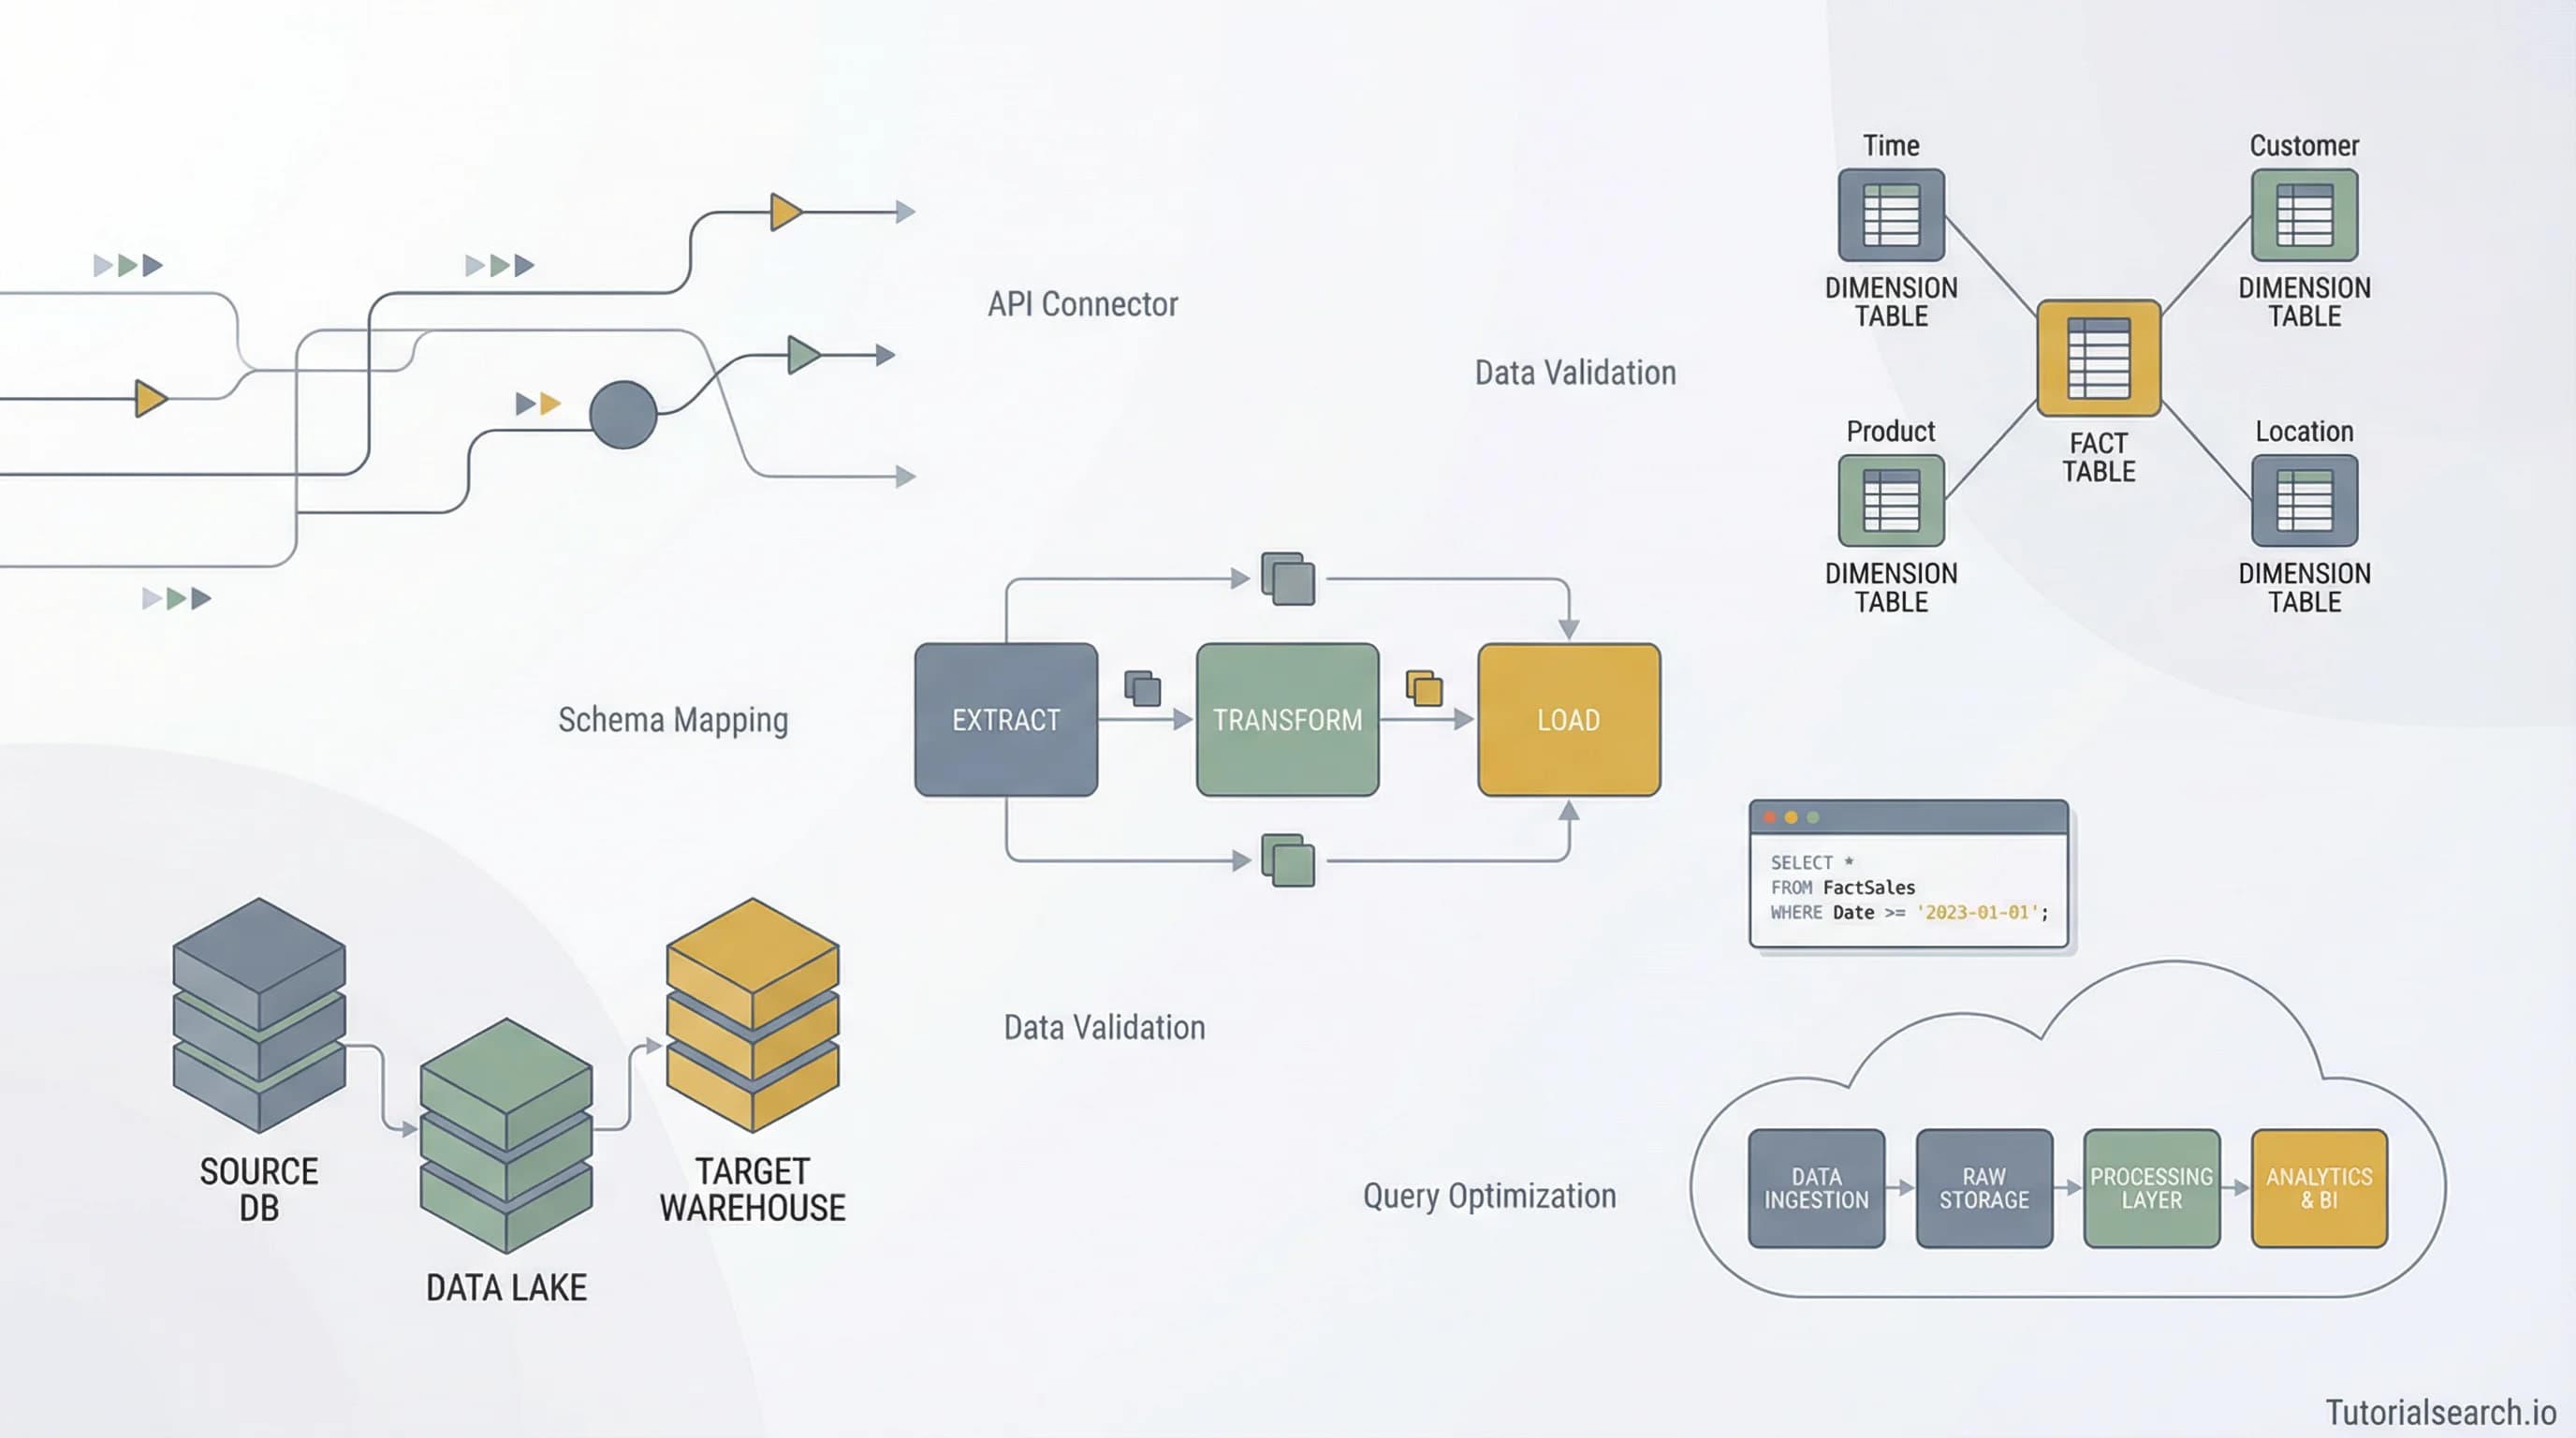
Data Warehousing Fundamentals: Architecture, Design & Implementation
Master modern data warehousing through architectural patterns, schema design, and practical implementation. Learn star schemas, ETL pipelines, and cloud platforms that power analytics at scale.
Hire the developers behind TutorialSearch.io
We built this site — full-stack web apps, AI integration & automation. Tell us what you need and we'll build yours.
Building a modern data warehouse isn't about implementing the newest technology or chasing cloud trends. It's about creating a reliable foundation where business decisions can actually happen—where data flows cleanly from operations to insights, where analysts can trust their numbers, and where the infrastructure doesn't become the bottleneck.
This guide walks you through data warehousing from the ground up, covering the foundational concepts, architectural patterns, and practical implementation strategies that separate thriving analytics environments from ones that slowly collapse under technical debt.
Key Takeaways
- Data warehousing creates a unified analytical hub that consolidates data from transactional systems, enabling reliable reporting and decision-making at scale
- Modern data warehouses separate compute from storage, allowing independent scaling and cost control compared to legacy on-premise systems
- Star schema and snowflake schema represent different tradeoffs: star schema prioritizes query speed, while snowflake schema reduces redundancy—choose based on your consistency and complexity needs
- ETL and ELT are complementary approaches: ETL offloads transformation to specialized engines, while ELT uses warehouse compute for simpler, faster pipelines on modern platforms
- Data quality and governance frameworks prevent the "garbage in, garbage out" problem through systematic monitoring, clear ownership, and automated validation
- Cloud data warehouses (Snowflake, BigQuery, Redshift) enable elastic scaling and reduce operational overhead, but each targets different workload patterns and cost models
Foundational Concepts of Data Warehousing
Most companies operate with a fragmented view of their business. Sales data lives in one system. Customer information spreads across a CRM. Marketing metrics hide in a separate platform. Finance runs their own database. When you need to know "which customer segment generates the most profit," you're stuck stitching data together manually.
Data warehousing solves this fragmentation by creating a central repository specifically designed for analysis. Unlike operational databases (which prioritize transaction speed and consistency), data warehouses prioritize analytical query performance and historical analysis.
Here's the fundamental insight: operational systems are built to answer "what just happened?" Data warehouses answer "what happened, why did it happen, and what should we do next?"
The Core Purpose
A data warehouse consolidates data from diverse sources including transactional databases, external APIs, marketing platforms, and customer support systems. This consolidated data is regularly refreshed, cleaned, and organized so analysts can discover patterns without fighting the underlying complexity of source systems.
When you have a proper data warehouse, business questions that once required IT intervention become self-service analyst problems. Instead of "I need someone to pull this report from five different systems," teams can ask their warehouse directly.
Key Differences from Operational Databases
Your transactional database is optimized for speed of insertion and updates. A data warehouse is optimized for analysis across millions or billions of rows. This distinction shapes everything about their design. Learn more about operational vs analytical databases to understand this distinction better.
Operational databases handle frequent small writes and reads. Data warehouses handle infrequent large inserts and frequent complex analytical reads. The architectural decisions that support one actively harm the other.
Understanding Data Warehouse Architecture
Modern data warehouse architecture typically consists of four layers, each with distinct purposes and characteristics.
The Source Layer
Your source layer contains all operational systems that generate business data. This includes:
- E-commerce platforms recording transactions
- Customer Relationship Management (CRM) systems tracking interactions
- Enterprise Resource Planning (ERP) systems managing operations
- Marketing automation platforms capturing campaigns
- Customer support systems logging issues
Source systems weren't built for analytics. They're optimized for operational speed, immediate consistency, and supporting the business process they enable. Pulling analytical data directly from production systems creates risk—slow queries can impact operational performance.
The Staging Layer
Before data enters your warehouse, it lands in a staging area. This intermediate zone serves several purposes that prevent disasters.
In staging, data from multiple sources exists in its raw form before transformation. This preserves an audit trail. If something goes wrong with transformation logic, you can reprocess the raw data without re-extracting from sources.
Staging also provides checkpoints. If your transformation fails partway through, you haven't corrupted your warehouse—you simply retry from the last successful checkpoint. Understand ETL pipeline best practices for building reliable staging areas.
The Warehouse Layer
The warehouse layer stores cleaned, transformed, and organized data optimized for analysis. This is where business logic lives—how you define customers, aggregate sales, calculate metrics.
Data warehouse design separates fact tables (measurable business events) from dimension tables (descriptive attributes). This separation enables efficient querying and clear semantics. Analysts understand instinctively that facts measure something (revenue, clicks, support tickets) while dimensions describe something (customer segment, product category, date).
The Consumption Layer
Finally, the consumption layer provides access to data through tools analysts actually use: business intelligence platforms, direct SQL query tools, data science notebooks, or automated dashboards.
Modern data warehouse architecture intentionally separates compute from storage. This separation enables the warehouse to scale storage and compute independently. You don't buy compute capacity you don't need just to store data, and you don't pay for storage you don't use just to have computation power.
This architectural shift from legacy on-premise systems to cloud-native platforms represents a fundamental change. Explore cloud data warehouse options to understand modern architecture patterns.
Schema Design Patterns for Data Warehousing
How you organize tables in your data warehouse directly impacts query performance, maintainability, and the speed with which analysts can answer business questions.
Two main approaches have emerged: star schema and snowflake schema. Each makes different tradeoffs that depend on your specific situation.
Star Schema: Speed and Simplicity
[Editors' Choice] Star schema organizes data around a central fact table surrounded by dimension tables, creating a structure that resembles a star when diagrammed.
A fact table contains quantifiable business metrics (revenue, clicks, support tickets) along with foreign keys pointing to dimension tables. Dimension tables provide context—customer information, product details, geographic location, time attributes.
Here's what makes star schema powerful: it minimizes joins. When an analyst wants to know "how much revenue by region in the last quarter," the warehouse combines one fact table with one dimension table. This simplicity means fast queries.
Star schema also makes semantic understanding straightforward. Business users don't need to understand database design—they need to know that sales_fact measures sales and customer_dim describes customers.
The tradeoff is data redundancy. If your customer dimension has 50 attributes and you have millions of sales transactions, you're storing customer attributes millions of times. This wastes storage and creates an update problem—if a customer moves to a new region, should historical transactions reflect the old region or new region?
Snowflake Schema: Organization and Normalization
[Editors' Choice] Snowflake schema extends star schema by normalizing dimensions further. Instead of one flat customer dimension, you might have separate tables for customers, customer_types, geographic_regions.
This normalization reduces redundancy. If a region's name changes, you update one record instead of potentially thousands.
Snowflake schema also organizes hierarchical relationships clearly. Your product dimension might split into products, product_categories, product_subcategories, capturing the hierarchy as separate tables.
The tradeoff is complexity. Queries now require more joins, potentially slowing analytics. An analyst querying by product subcategory now joins the fact table through product, product_category, then product_subcategory.
When should you choose each? Star schema wins when you prioritize query speed and analyst simplicity. It's ideal for data warehouses supporting many concurrent analytical queries. Snowflake schema wins when you have complex hierarchical dimensions and storage efficiency matters significantly.
Many teams use a hybrid approach—star schema for frequently queried dimensions, with some normalized structures for slowly-changing or complex hierarchies.
Modern Dimensional Modeling Practices
[Editors' Choice] Contemporary data warehousing often adds slowly changing dimensions (SCDs) that track changes over time. If a customer changes regions, SCD strategies track both the old and new region, with effective dates.
This solves the historical accuracy problem. You can analyze revenue by region not just as it is today, but as it was on any historical date.
You'll also encounter conformed dimensions—shared dimensions across multiple fact tables. A date dimension used by both sales and customer_support fact tables should be identical. This enables analysis combining data across fact tables while maintaining consistency.
ETL and ELT Pipelines in Data Warehousing
Getting data from operational systems to your warehouse happens through two competing approaches: ETL (Extract, Transform, Load) and ELT (Extract, Load, Transform).
ETL: The Traditional Approach
ETL extracts raw data from sources, transforms it using specialized transformation engines, then loads it into the warehouse.
The transformation step includes the heavy lifting: joining data from multiple sources, calculating metrics, enforcing business rules, cleaning inconsistencies, deduplicating records, validating quality.
ETL makes sense when transformation is expensive or complex. If you have sophisticated business logic—combining three sources with specific rules, applying regulations compliance logic, protecting sensitive data—a specialized transformation engine removes this computational load from your warehouse.
ETL also works well when source systems are fragile. If extracting from production impacts operational performance, you want transformation happening elsewhere, not in production. ETL lets you extract, then transform asynchronously without impacting operations.
The drawback: you maintain a separate transformation system. This adds complexity, operational overhead, and potential failure points.
ELT: The Modern Alternative
ELT loads raw data into the warehouse, then uses the warehouse's own compute power for transformation.
This approach became practical when cloud data warehouses offered elastic, affordable compute. If your warehouse can scale compute on demand, using its compute for transformation makes economic sense.
ELT also preserves raw data. Your warehouse stores both raw and transformed data, enabling exploratory analysis on raw data and supporting future schema evolution. If you discover you missed calculating something important three months ago, you can recalculate from raw data without re-extracting from sources.
ELT works beautifully for big data scenarios where scalable storage (like cloud object storage) feeds the warehouse. Data lands in cloud storage, then the warehouse processes it using its native SQL engine.
The limitation: your warehouse must be powerful enough for your transformation logic. If your transformation needs sophisticated programming (Python, complex algorithms), ELT becomes awkward.
Practical Implementation Patterns
Most modern teams use both approaches. Real-time operational data flows through ELT—land it quickly in the warehouse, transform with warehouse compute. Complex transformations requiring specialized logic use ETL with dedicated orchestration.
Regardless of approach, certain practices ensure reliability. Staging data before warehouse loading provides rollback capability. If transformation fails midway, you haven't corrupted your warehouse.
Parallelization matters. While data is being extracted, transformation can process previously extracted data, and loading can process previously transformed data. This pipeline approach runs faster than sequential extraction, then transformation, then loading.
Tracking data lineage—recording exactly how data flows from source to warehouse to final report—prevents silent failures. When an analyst questions a number, you trace its origin.
Data Quality and Governance in Data Warehousing
Hire the developers behind TutorialSearch.io
We built this site — full-stack web apps, AI integration & automation. Tell us what you need and we'll build yours.
A perfectly architected warehouse with beautiful schema design fails if people can't trust the data.
Data quality problems silently destroy credibility. A single incorrect customer revenue number compounds through reports until decisions based on false premises hit revenue by millions. Yet quality problems often go undetected until damage is done.
Data governance prevents these disasters through systematic approaches to data management.
Key Data Quality Dimensions
Data quality has multiple dimensions, and excellence requires attention to each.
Accuracy measures whether data values correspond to reality. A customer's revenue should match what actually occurred. Accuracy problems often originate in source systems—incorrect data entry, system bugs, process failures.
Completeness measures whether required data is present. A customer record without email in a customer dimension should trigger investigation. Some analytics remain impossible with incomplete data.
Timeliness measures whether data is available when needed. If your ETL runs nightly but executives need real-time dashboards, timeliness fails.
Consistency compares records across systems. If the same customer appears with different names in your CRM and warehouse, consistency has failed. Consistency problems usually reflect integration issues.
Uniqueness tracks duplicate records. If the same order appears twice in your fact table, you'll overcount revenue.
Addressing all five dimensions creates a robust data foundation. Implement data quality metrics to measure these dimensions systematically.
Governance Frameworks
Data governance establishes ownership, policies, and accountability for data quality.
A functional governance framework defines which team owns each data asset. Who owns customer dimension? Who validates its quality? Who makes decisions about schema changes?
Governance also establishes policies. How often should dimension updates occur? What constitutes acceptable latency? How long should historical data be retained?
Most importantly, governance creates accountability. When data quality fails, governance identifies who should know, how quickly they should respond, and what actions are required.
Many organizations establish data stewards for critical dimensions. The customer data steward owns customer_dim quality, coordinates updates, investigates anomalies.
Practical Quality Assurance
Quality monitoring requires both reactive and proactive approaches.
Reactive monitoring catches failures after they happen. A report exceeds normal variance thresholds—an alert triggers investigation. A dimension receives an update with null values—validation rules reject it.
Proactive monitoring prevents failures. Automated tests validate that every transformation produces expected results. Data profiling identifies anomalies before they reach downstream consumers.
A typical quality framework monitors:
- Row counts (does fact_sales have the expected record count today?)
- Null percentages (does customer_dim have unexpected nulls?)
- Uniqueness (do all dimension records have unique keys?)
- Referential integrity (does every sale reference a valid customer?)
- Business logic (is revenue always positive?)
- Staleness (has customer_dim been updated in the last 24 hours?)
Automation makes this feasible at scale. Without it, teams lack visibility into quality status.
Choosing the Right Cloud Data Warehousing Platform
Cloud data warehouses have become the default choice, replacing traditional on-premise systems. But choosing between major platforms—Snowflake, Google BigQuery, Amazon Redshift—requires understanding their different strengths.
Snowflake: Flexibility and Ease
Snowflake offers a hybrid architecture with genuinely separated compute and storage. This separation enables features that other platforms struggle with.
Snowflake's compute resources scale independently from storage, making it simple to handle variable workloads. If executives need a report run at 3 AM on a Sunday, you create a temporary compute cluster, run the query, delete the cluster. You don't over-provision permanent capacity.
Snowflake runs on AWS, Azure, and Google Cloud, making it genuinely multi-cloud. This flexibility helps if you're committed to cloud choice independence.
Snowflake also excels at concurrent query management. Unlike older data warehouses that degrade under load, Snowflake distributes queries across available compute without one slow query blocking others.
The tradeoff: Snowflake costs more per terabyte than some competitors, especially for high-concurrency workloads. Licensing based on compute minutes adds up if you're not careful.
BigQuery: Simplicity and Real-Time
Google BigQuery takes serverless to an extreme. You provision nothing—no clusters, no capacity planning. Point to data, query it, receive results.
BigQuery shines with real-time data ingestion. Its streaming API makes it trivial to inject real-time events. Where Snowflake requires Snowpipe (an additional service), BigQuery handles streaming natively.
BigQuery's columnar storage format optimizes analytical queries. It stores data by column rather than row, making analytical scans faster when you're only accessing specific columns.
BigQuery integates seamlessly with Google Cloud ecosystem. If you're already using Google Cloud for other services, integration is natural.
The tradeoff: BigQuery charges based on data scanned, not data processed. A poorly written query scanning a terabyte of data when you only need a gigabyte becomes expensive quickly. You need data governance discipline.
Redshift: AWS Integration
Amazon Redshift integrates tightly with the AWS ecosystem. If you're building on AWS, Redshift connects directly to S3 data lakes, Kinesis streaming, RDS databases.
Redshift uses shared-nothing architecture with cluster nodes working in parallel. This architecture enables massive parallelization for large analytical queries.
Redshift offers predictable pricing if you commit to reserved instances, making budgeting easier for stable workloads.
The tradeoff: Redshift requires more operational management than Snowflake or BigQuery. You provision and scale clusters manually. This gives more control but demands more expertise.
Building Your First Data Warehousing Implementation
Moving from strategy to implementation requires concrete choices. Here's a practical path forward.
Phase 1: Define Your Analytics Needs
Before designing anything, understand what questions your business needs to answer. Sales wants to understand customer lifetime value. Marketing wants to track campaign performance. Operations wants to monitor key metrics.
Write these questions down. They become your requirements. A customer lifetime value question requires order history, customer attributes, and cohort analysis capabilities. This shapes schema design.
Identify your most critical fact—probably sales transactions, customer interactions, or operational metrics. This becomes your initial focus.
Phase 2: Assess Your Source Systems
Map every system that feeds data you need. Document data structures, refresh frequency, access constraints, and data quality issues.
Source systems often have quality problems. A sales system might misclassify orders or allow duplicate entries. Document these issues before they surprise you in the warehouse.
Assess feasibility of extraction. Some systems offer easy APIs. Others require direct database access. Some impose extraction limitations. These constraints shape your ETL approach.
Phase 3: Design Your Schema
Start with a simple star schema covering your highest-priority fact. A sales warehouse might have sales_fact (transactions) surrounded by customer_dim, product_dim, date_dim, channel_dim.
Avoid over-designing. You can refactor schema design as requirements evolve. Start with what you know, then iterate.
Identify slowly changing dimensions. How do you handle product category changes? Customer region changes? This becomes SCD logic in your pipeline.
Phase 4: Implement Your Pipeline
Choose your platform. If evaluating, most offer good free tiers for learning. Explore professional data warehousing courses to deepen your implementation skills.
Implement ETL or ELT for your highest-priority fact. Start simple—extract raw data, load to warehouse, transform as needed.
Build staging areas with data validation. Don't let bad data reach your warehouse without scrutiny.
Phase 5: Enable Analytics
Connect business intelligence tools to your warehouse. Create initial dashboards answering your highest-priority questions.
Share results with stakeholders. Get feedback. Let them identify data quality issues or incorrect logic.
Iterate. Data warehousing is rarely perfect from launch. Each iteration improves quality and reduces technical debt.
Common Pitfalls and How to Avoid Them
Experienced teams repeatedly encounter the same failure patterns. Knowing them helps you avoid costly mistakes.
Pitfall 1: Storing Raw Source Data Unchanged
Teams sometimes think dumping data from source systems into the warehouse satisfies their needs. It doesn't.
Source data includes operational complexity that confuses analysis. An order marked "cancelled" might be truly cancelled or just returned. A customer record might have duplicates that haven't been deduplicated. Dimension attributes might contradict each other.
Avoid this by establishing clear transformation logic that resolves ambiguities, handles duplicates, and enforces business rules. Your warehouse should implement your business logic, not expose source complexity.
Pitfall 2: Ignoring Slowly Changing Dimensions
Teams that don't implement slowly changing dimension logic end up unable to answer historical questions correctly.
If a customer moves from Region A to Region B, historical transactions now show Region B. But those transactions occurred when the customer was in Region A. This makes historical analysis of region performance impossible.
Implement SCD logic from the start. Type 2 SCDs (maintaining history with effective dates) require slightly more complexity but enable correct historical analysis.
Pitfall 3: Accepting Data Quality Without Discipline
Some teams treat data quality as nice-to-have rather than required.
This inevitably leads to silent failures. A campaign analysis that counts a customer twice drives wrong decisions. Revenue calculations based on outdated customer information mislead executives.
Build quality monitoring from the start. Run tests validating every transformation. Alert on anomalies. Create dashboards showing quality metrics.
Pitfall 4: Assuming Warehouse Compute Scales Infinitely
Teams sometimes write inefficient queries assuming "the warehouse will handle it."
While cloud warehouses scale impressively, they're not infinitely efficient. A query scanning billions of rows unnecessarily will be slow and expensive, even on a scalable platform.
Write efficient queries. Use appropriate indexes (warehouses offer different indexing than transactional databases). Partition large tables intelligently.
Pitfall 5: Neglecting Documentation
Schema logic that seems obvious to the designer becomes mysterious to analysts months later.
Document your schema—which tables are facts, which are dimensions, what each field represents. Document transformation logic. Document data lineage.
This documentation often feels tedious. But when an analyst questions why a metric changed, documentation prevents hours of detective work.
Data Warehousing FAQ
What is the difference between data warehousing and data lakes?
Data warehouses store structured, organized data optimized for analysis. Data lakes store raw data in its native format (structured, semi-structured, unstructured) optimized for preservation and future analysis.
Most organizations now use both—data lakes for raw data preservation and flexible exploration, data warehouses for structured analytics. The emerging "lakehouse" architecture attempts to combine benefits of both.
How long should data warehousing projects take?
Simple initial implementations can succeed in 2-3 months if you scope narrowly (single fact table, key dimensions, basic ETL). More comprehensive warehouses require 6-12 months.
The timeline depends heavily on source system complexity and organizational readiness. If source systems are unstable or organizations disagree on business logic, projects stretch longer.
Can you migrate from traditional data warehouse to cloud without rebuilding?
Most migrations require schema redesign. Traditional on-premise warehouses optimize for different constraints (storage cost, compute availability) than cloud systems. Taking advantage of cloud benefits usually requires rearchitecture.
However, you can migrate data wholesale while maintaining schema, then refactor incrementally. Many teams choose this phased approach to reduce risk.
What skills should my data warehousing team have?
You need SQL expertise (fundamental). You need someone understanding data modeling and schema design. You need operational experience managing your chosen platform.
Modern warehouses also benefit from software engineering practices—version control for schema and transformation code, testing, CI/CD pipelines. Hiring people with data engineering background (not just database administration) helps.
How do you handle real-time data in data warehouses?
Traditional data warehouses batch updates nightly. Real-time requirements have multiple approaches.
Cloud platforms like BigQuery and Snowflake support streaming ingestion. You also see micro-batching (updates every minute) and event streaming (pushing events to streaming platforms, separately from the warehouse).
The right approach depends on latency requirements. Nightly batches work for most analytics. Streaming makes sense if you need dashboard updates within seconds.
How should you handle privacy regulations in data warehousing?
Data warehousing interacts with privacy regulations (GDPR, CCPA, HIPAA) in important ways.
Build deletion capability—when someone requests deletion, ensure the warehouse can remove their data. Implement encryption for sensitive fields. Document data lineage so you know where sensitive data flows.
Some organizations maintain separate warehouses for regulated data. Others use row-level security to restrict access. The approach depends on your data sensitivity and organizational risk tolerance.
Related Topics to Explore
Continue your data science and analytics learning by exploring these connected areas:
- Data Visualization - Transform warehouse data into insights through effective visualization
- Python Analysis - Use Python for advanced analytical work with warehouse data
- Data Engineering - Build robust data pipelines feeding your warehouse
- Business Analytics - Apply warehouse data to business decision-making
- Big Data - Handle massive data volumes across distributed systems