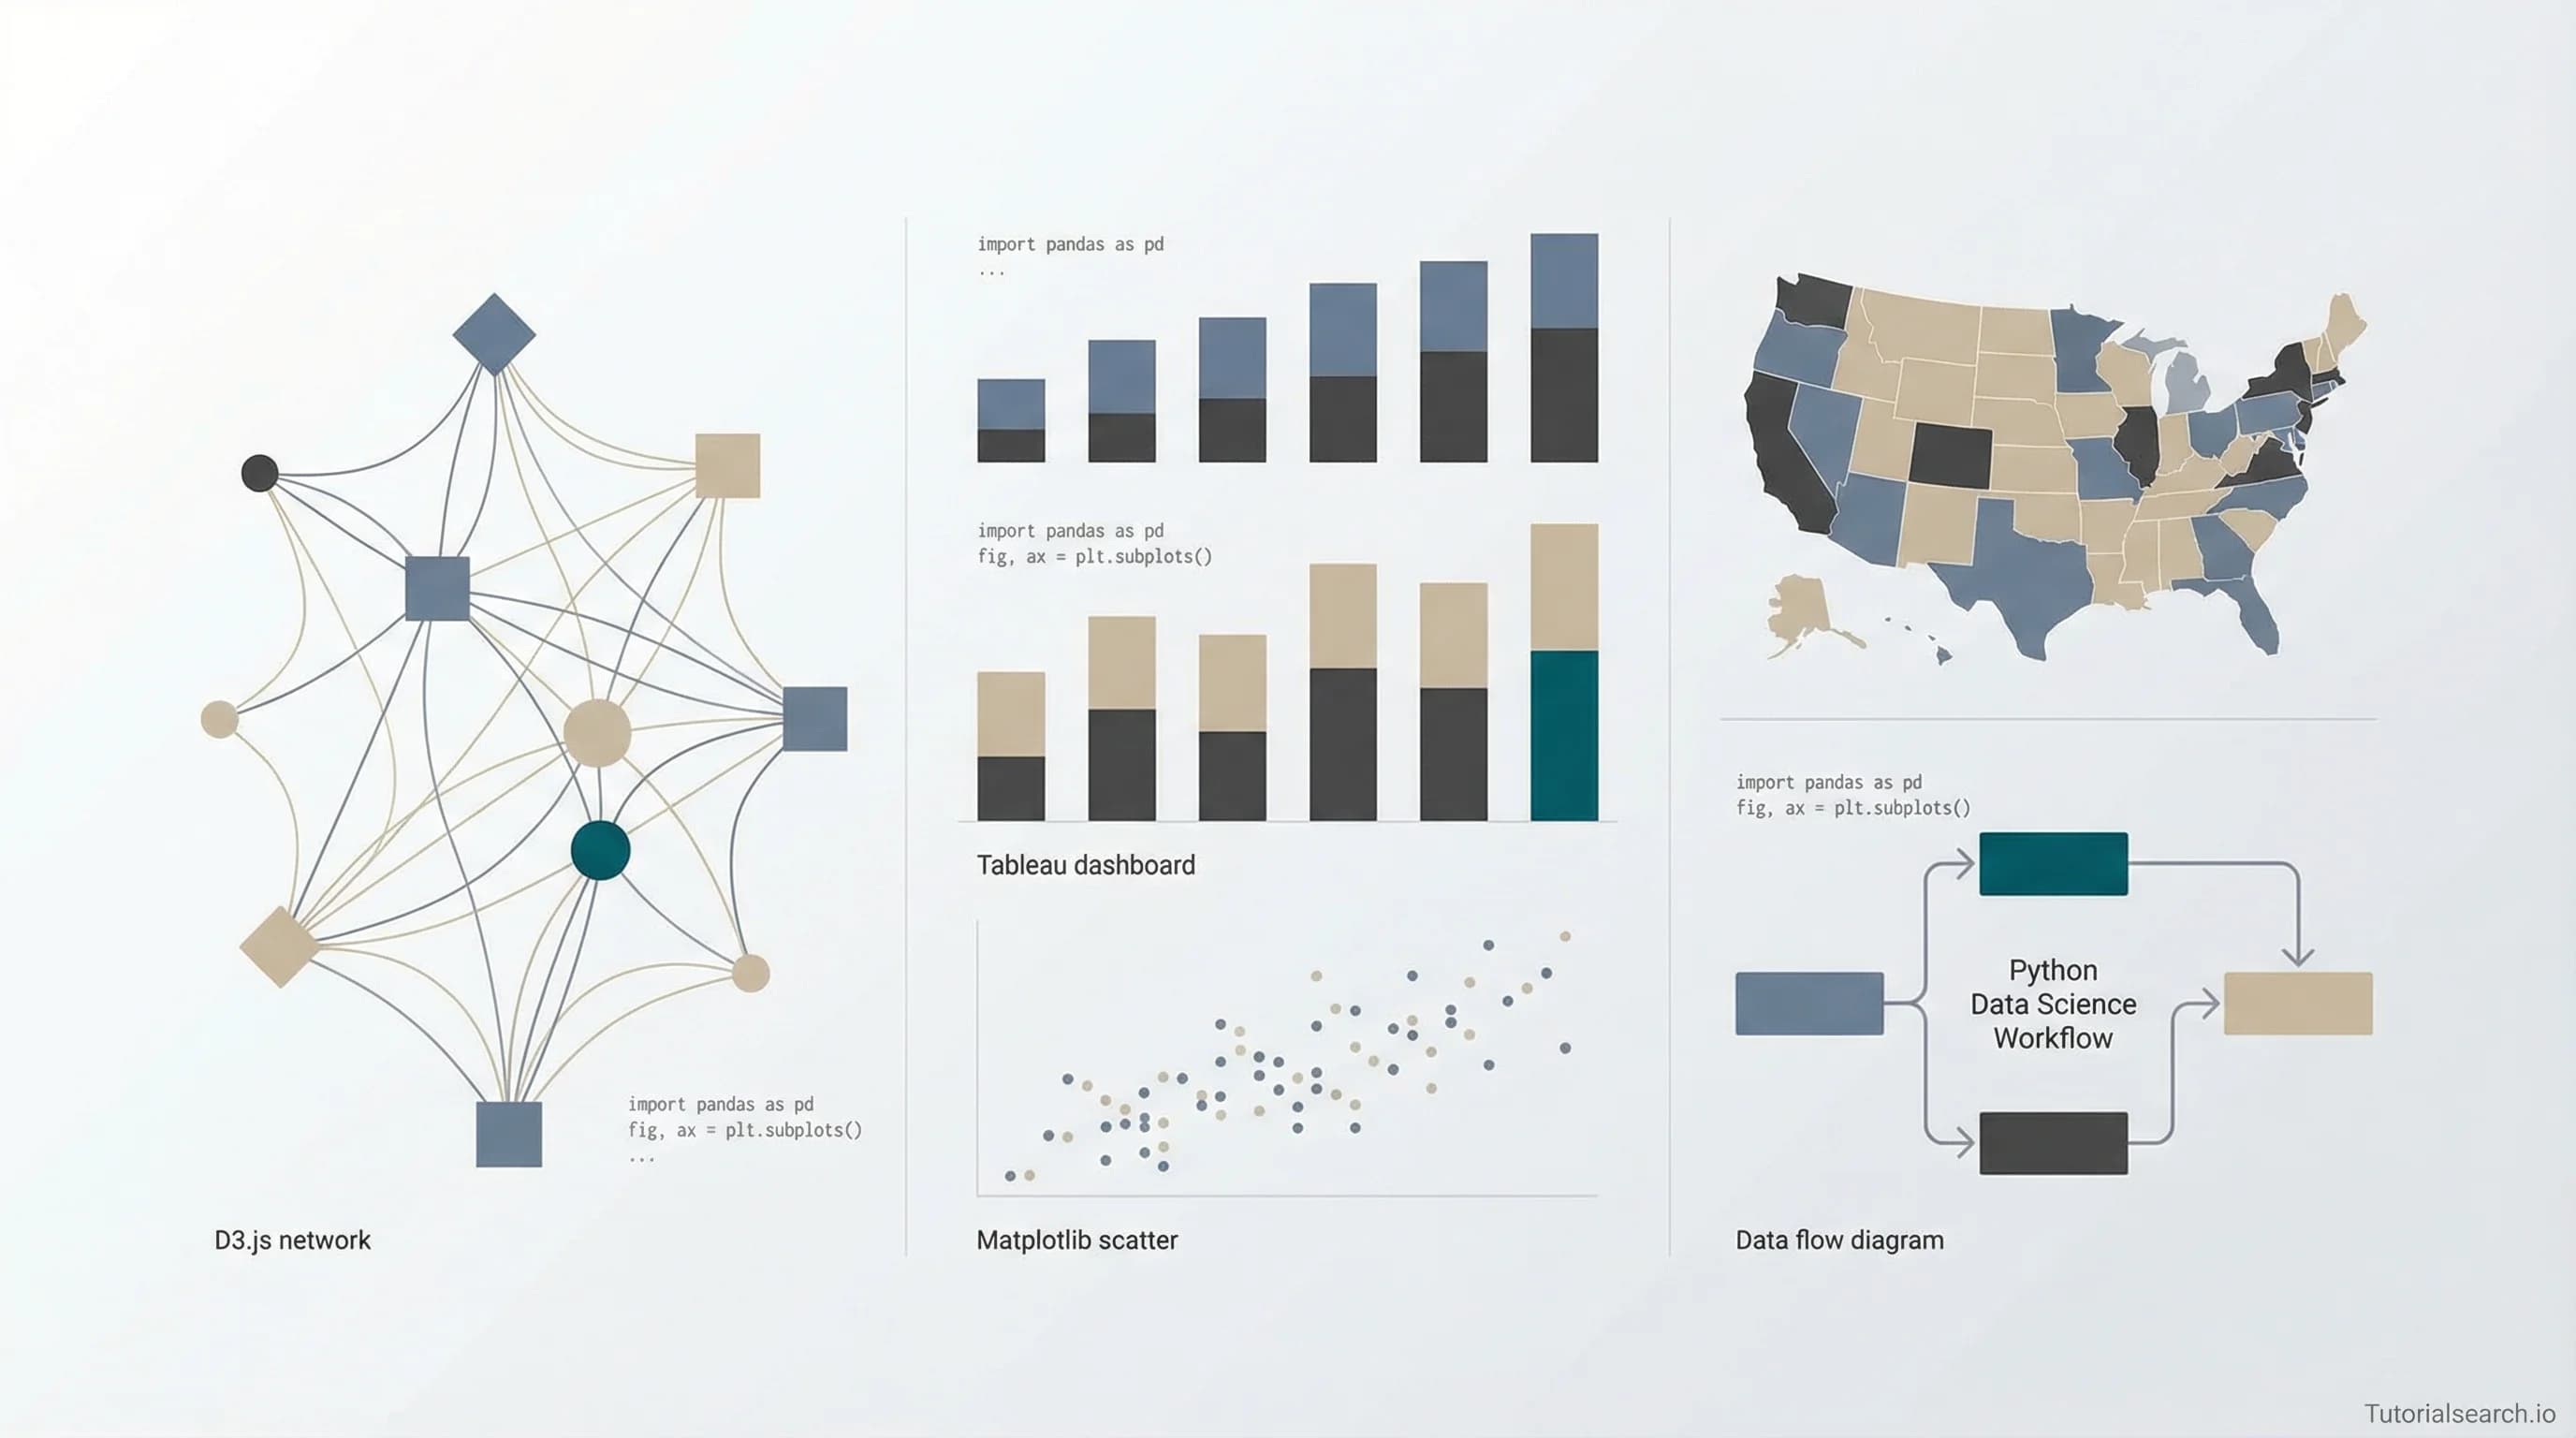
30+ Best Resources To Learn Data Visualization From Scratch in 2026
A curated guide to the best courses, books, YouTube channels, GitHub repos, and free resources for learning data visualization in 2026 — from Python and D3.js to Tableau and Power BI.
Want AI in your product? Hire the team behind TutorialSearch.io
LLM features, RAG, agents and automation wired into a real product — built by the devs who shipped this site.
Why Data Visualization Matters More Than Ever
If you've ever sat through a meeting where someone throws a spreadsheet with 47 columns on the projector and says "as you can clearly see..." — you already know why data visualization matters. Nobody can clearly see anything in a raw spreadsheet. That's the whole point.
Data visualization is the art and science of turning numbers into pictures that actually tell a story. And in 2026, it's not just a nice-to-have skill — it's basically table stakes for anyone working with data. Whether you're a data scientist presenting findings to stakeholders, a business analyst building dashboards, or a developer creating interactive web reports, knowing how to visualize data effectively is what separates "here's some numbers" from "here's what these numbers mean."
Companies like Netflix, Airbnb, Spotify, and The New York Times have entire teams dedicated to data visualization. Google's been investing heavily in tools like Looker Studio. And honestly? The demand for people who can make data beautiful and understandable has never been higher.
This guide is for anyone who wants to level up their data visualization skills — whether you're a complete beginner or someone who knows their way around a bar chart but wants to go deeper. I've rounded up the best courses, tools, books, YouTube channels, and free resources so you don't have to waste hours searching. Let's dive in.
Prerequisites: What You Should Know First
Before jumping into data visualization specifically, it helps to have some basics down. You don't need to be an expert, but having a foundation in at least one of these areas will make everything click faster:
- Basic statistics — mean, median, distributions, correlation. Nothing fancy, just enough to understand what your data is telling you.
- One programming language — Python is the most popular choice in the data world, but R, JavaScript, and even Excel formulas count here.
- Comfort with data — If you've ever cleaned a messy CSV file or written a SQL query, you're already ahead of the game.
If you're starting completely from scratch, check out the Data Science Skills page on TutorialSearch.io for foundational courses. And for Python specifically, there's a solid collection of Python Analysis courses that pair well with visualization learning.
Official Documentation & Getting Started Guides
Always start with the official docs. I know, I know — documentation can be dry. But these are actually good:
Python: Matplotlib
Matplotlib is the grandparent of Python data visualization. It's been around forever, it's incredibly flexible, and basically every other Python viz library is built on top of it. The Quick Start Guide is surprisingly approachable, and the Pyplot Tutorial will have you making charts in minutes.
JavaScript: D3.js
D3.js is the gold standard for interactive web visualizations. Fair warning though — it has a steep learning curve. Like, really steep. But the Getting Started guide has gotten much better over the years. If D3 feels overwhelming, check out Observable Plot, the team's higher-level library that can do in one line what takes D3 fifty. Seriously — a histogram in one line of code.
Tableau Public
If you're more of a drag-and-drop person, Tableau Public is free and incredibly powerful. The official Tableau YouTube channel has tons of tutorials, and the learning curve is way gentler than code-based tools.
Best Paid Courses for Data Visualization
Here's where I get opinionated. I've looked at a lot of courses — like, an unreasonable number — and these are the ones actually worth your time and money.
1. [Editors' Choice] Data Visualization in Excel: All Excel Charts and Graphs
Instructor: Start-Tech Academy | Platform: Udemy | Rating: 4.5 | Students: 164,000+
Ok hear me out — I know Excel isn't sexy. But this is hands down the most practical data visualization course out there. Why? Because almost everyone has Excel, almost every job uses Excel, and Start-Tech Academy does an amazing job walking through every single chart type. If you're in business or consulting, this course is where I'd start. Over 164,000 students have taken it and the 4.5 rating speaks for itself.
2. Data Visualization with Python and New Methods in Matplotlib
Instructor: S. Emadedin Hashemi | Platform: Udemy | Rating: 4.5 | Students: 31,900+
If you're going the Python route, this course goes beyond the basics and covers new Matplotlib methods that most courses skip. Hashemi's teaching style is clear and methodical — not flashy, but you'll actually learn stuff. The focus on newer Matplotlib features is what sets this apart.
3. [Editors' Choice] D3.js Data Visualization Fundamentals - Hands On
Instructor: Vincent Gomez | Platform: Udemy | Rating: 4.8 | Students: 14,100+
For anyone who wants to build interactive web visualizations, this D3.js course is the real deal. Gomez takes a genuinely hands-on approach — you're building stuff from the first lesson. The 4.8 rating isn't an accident. I particularly like that he doesn't rush through the SVG fundamentals, which is where most D3 learners get tripped up.
4. Data Visualization with Kibana
Instructor: Bo Andersen | Platform: Udemy | Rating: 4.5 | Students: 30,500+
If you're working with Elasticsearch or need to visualize log data and time series, Kibana is your friend. Bo Andersen is one of those instructors who just makes complex things feel simple. This is a more specialized pick but if it's what you need, nothing else comes close.
5. Zero to Hero in Tableau: Data Visualization using Tableau
Instructor: Start-Tech Academy | Platform: Udemy | Rating: 4.6 | Students: 35,900+
Another gem from Start-Tech Academy. This Tableau course lives up to its name — you genuinely go from zero to being productive in Tableau. The pace is good, the examples are practical, and you'll be building dashboards by the end that actually look professional.
6. Data Visualization with Python for Beginners
Instructor: Max A | Platform: Udemy | Rating: 4.6 | Students: 19,000+
For Python beginners specifically, this course keeps things approachable without dumbing anything down. Max does a great job explaining why you'd choose one chart type over another — which honestly is the hard part. The code stuff you can always Google, but knowing when to use a scatter plot vs. a heatmap? That's real skill.
You can browse all 1,500+ data visualization courses on TutorialSearch.io to find exactly what fits your learning style.
Best Free Courses & Resources
Not everyone wants to drop money on courses right away, and honestly, some free resources are surprisingly good. Here are the ones that are actually worth your time:
1. [Editors' Choice] Data Visualization in Python Masterclass for Data Scientists (Free)
Platform: Udemy | Rating: 4.5 | Students: 22,400+
This one blew my mind a little — a completely free, high-quality Python visualization masterclass. It covers Matplotlib, Seaborn, and Plotly. The production quality is solid and it doesn't feel like a "teaser" for a paid course. Genuinely useful standalone content.
2. Data Visualizations with Power BI (Free)
Platform: Udemy | Students: 11,800+
If Power BI is your tool of choice, this free course from Rahim Zulfiqar Ali covers the fundamentals nicely. Not as comprehensive as paid options, but a solid starting point. Check out our Power BI Analysis page for more options.
3. Data Visualization with Excel - Crash Course (Free)
Students: 21,700+ | Rating: 4.4
Need Excel visualization skills fast? This crash course is exactly what it sounds like — quick, practical, and free. Perfect if you have a presentation next week and need to make your charts not look terrible.
4. Kaggle's Data Visualization Micro-Course
Kaggle Learn offers a fantastic free micro-course that takes about 4 hours. It covers bar charts, line charts, heatmaps, and scatter plots using Seaborn. What I love about it is the hands-on notebook format — you write code directly in your browser with real datasets. No setup required.
5. freeCodeCamp's D3.js Tutorial
freeCodeCamp has a solid D3.js tutorial for beginners that covers the fundamentals without assuming you already know everything about JavaScript. It's text-based with code examples, which I personally prefer over video when learning a new library.
6. Codecademy's Data Visualization Track
Codecademy offers interactive data visualization courses where you learn by doing. The browser-based coding environment means zero setup friction — just start typing code and see results immediately.
Learn From GitHub
Want AI in your product? Hire the team behind TutorialSearch.io
LLM features, RAG, agents and automation wired into a real product — built by the devs who shipped this site.
GitHub is honestly an underrated learning resource for data visualization. Some of the best curated knowledge lives in these repos:
1. [Editors' Choice] awesome-dataviz
hal9ai/awesome-dataviz — This is the motherlode. A curated list of open-source data visualization frameworks, libraries, and software covering JavaScript (D3, Chart.js, ECharts, ApexCharts), Python (Altair, Plotly, Seaborn, PyVista), React components (Recharts, Victory, nivo), and mapping tools (Leaflet). If you're trying to figure out which tool to use for what, start here. Seriously — I wish I'd found this when I was starting out instead of spending weeks comparing libraries on my own.
2. awesome-dataviz-education
datavis-tech/awesome-dataviz-education — A curated collection of open educational content. Includes Amelia Wattenberger's fantastic "Fullstack D3" course, Shirley Wu's D3 course on Frontend Masters, and a Google-supported MOOC on Data Journalism and Visualization. It's basically a syllabus that someone already built for you.
3. awesome-datascience
academic/awesome-datascience — With 28,000+ stars, this covers the full data science stack including a dedicated visualization section. If you're learning data visualization as part of a broader data science journey — which most people are — this repo gives you the complete picture.
4. awesome-r-dataviz
krzjoa/awesome-r-dataviz — R users, this one's for you. Curated resources for data visualization, drawing, and publishing in R. Includes books, packages, and examples specifically for ggplot2 and the R ecosystem. If you're coming from an academic or statistics background, R is still king for publication-quality charts.
Learn From YouTube
YouTube is absolutely packed with data visualization content, but finding the good stuff takes effort. I've done the filtering for you — these channels and playlists consistently deliver:
1. Tableau Official Channel
Tableau — Product demos, customer success stories, and tutorials straight from the source. Their "Getting Started" series is excellent, and they regularly post about new features. Not the most exciting content in terms of personality, but the quality and accuracy are top-notch.
2. Guy in a Cube
For Power BI specifically, Guy in a Cube is the channel. Adam Saxton and Patrick LeBlanc cover everything from DAX formulas to report design with genuine enthusiasm. Their Getting Started with Power BI playlist is particularly well-structured for beginners.
3. Akshit Madan's Python Data Analysis & Visualization
Akshit Madan has a comprehensive playlist covering Pandas, NumPy, Matplotlib, and Seaborn from basics to advanced. His "Data Analysis & Visualisation for Beginners" series is a complete guide that I'd put up against many paid courses.
4. Andy Kriebel's Tableau Tips
Andy Kriebel runs a YouTube series with tutorials focusing on specific Tableau techniques — from creating specific chart types to mastering dynamic zone visibility. These are bite-sized and practical, perfect for when you need to solve a specific problem.
5. 3Blue1Brown
Ok this is kind of a wildcard pick, but 3Blue1Brown creates the most beautiful mathematical visualizations you'll ever see. Even if you don't care about the math, watching his videos will fundamentally change how you think about visual storytelling with data. His tool (Manim) is open-source too.
6. Sentdex
Sentdex has extensive Python tutorials including dedicated Matplotlib and data visualization content. Harrison's style is very code-along friendly — he types, you type along, and stuff works.
7. David McCandless TED Talk
Not a channel, but David McCandless's TED Talk "The Beauty of Data Visualization" is required viewing for anyone entering this field. It's about 20 minutes and it'll shift how you think about presenting data. My friend who's a senior data scientist recommended this to me years ago and honestly it changed how I approach every dashboard I build.
Best Books for Data Visualization
Some things are better learned from books — especially design principles and visual thinking, which don't translate as well to video courses.
1. [Editors' Choice] Storytelling with Data by Cole Nussbaumer Knaflic
This is the book I recommend to literally everyone. It's tool-agnostic, so whether you use Excel, Tableau, Python, or crayons, the principles apply. Knaflic focuses on the communication side — how to choose the right chart, how to declutter, how to guide your audience's attention. After reading this, you'll never look at a pie chart the same way again. (Spoiler: she's not a fan of pie charts. And after reading why, neither am I.)
2. Fundamentals of Data Visualization by Claus O. Wilke
The best part about this one? It's free online at clauswilke.com/dataviz. Wilke covers everything from color theory to chart types to common visualization pitfalls. It's more academic than "Storytelling with Data" but incredibly thorough. I keep going back to the chapter on color coding whenever I'm designing a new dashboard.
3. Data Visualization: A Practical Introduction by Kieran Healy
Available both as a book and partially online at socviz.co, Healy's approach is hands-on with ggplot2 in R. Even if you don't use R, the principles he teaches about what makes a visualization effective are universal. The examples are gorgeous and the writing is surprisingly engaging for a textbook.
4. How Charts Lie by Alberto Cairo
This one's different — instead of teaching you how to make charts, Cairo teaches you how to read them critically. In an era of misleading infographics and cherry-picked data, this is essential reading. I burned through it in two evenings and now I can't unsee bad charts. Everywhere. They're everywhere.
Additional Useful Links & Communities
Here's a grab bag of other resources that didn't fit neatly into the sections above but are absolutely worth bookmarking:
Communities:
- r/dataisbeautiful — One of Reddit's best communities with over 20 million members sharing and critiquing visualizations
- r/visualization — A smaller but more technically focused subreddit
- Data Science Discord — Active community with 19,000+ members and dedicated visualization channels
- Women in Dataviz Discord — Supportive community specifically for women in the field
Tools to Try:
- RAWGraphs — Free, open-source tool built on D3.js for custom visualizations without coding
- Datawrapper — Create interactive charts and maps online with zero coding
- Observable — Interactive notebooks for JavaScript data visualization (think Jupyter but for the web)
Learning Paths:
- roadmap.sh/data-analyst — Community-driven roadmap that shows where data visualization fits in the broader data analyst journey
- Dataquest's 2026 Data Skills Roadmap — Practical guide to what skills matter this year
For more related topics, explore Business Analytics courses, dive into Data Engineering if you want to work with bigger datasets, or check out Data Science Methods for the analytical side. If you're into geospatial data, our Spatial Analysis collection has some hidden gems too.
Wrapping Up
Look — data visualization isn't just about making pretty charts. It's about making data understandable, making decisions clearer, and honestly, making your work look way more impressive than a wall of numbers ever could.
My advice? Start with one tool and get really good at it before branching out. If you're a Python person, go with Matplotlib and Seaborn. If you want something more visual and drag-and-drop, Tableau Public is free and incredibly capable. If you're building for the web, D3.js is the gold standard but be prepared for a learning curve.
And whatever tool you pick, read "Storytelling with Data" by Cole Knaflic. The tool stuff you can learn in a weekend — but understanding how to communicate with data? That's the skill that'll actually set you apart.
Got a favorite data visualization resource I missed? Drop it in the comments — I'm always looking for new stuff to add to my toolkit. Happy visualizing!